DB2 monitoring with prometheus
Why to use prometheus? Developing our own exporter for IBM DB2.
DB2
DB2 is a relational database management system (RDBMS) like PostgreSQL or MySQL that is developed by IBM to play a critical role as data store in mostly large organizations historically. Even today in 2022 some of the most critical data globally is stored in DB2 running on IBM's system Z, system i or non IBM "LUW" (Linux Unix Windows) platforms and cloud offerings.
DB2 is known to be a very reliable data store with a pretty solid transaction management system. However, we know as administrators that if you can't measure a system, you can't manage or improve it. So let 's get involved.
Prometheus
Prometheus is an open source, system monitoring and alerting toolkit that has "only" 10 years of history (DB2 counts 40 years since its first release). The core of Prometheus it a time-series data store (TSDB: database optimized to store and serve values related to specific time frames). The other two basic components of Prometheus are:
Data Retrieval Worker: Its basically a scheduler that connects to other services via http and retrieves metrics periodically
API (with a simple web UI): Serves the values of a metric in a time frame. You can "query" the metric using PromQL (Prometheus Query Language) syntax
Exporters
An exporter is another service (or agent) that is usually packaged along with the service we need to monitor. Its job is to "translate" the metrics into a format that is perceived by Prometheus. Three of the most known exporters are:
node_exporter: Hardware and OS metrics exposed by *NIX kernels
windows_exporter: A Prometheus exporter for Windows machines
blackbox_exporter: Probing of endpoints over HTTP, HTTPS, DNS, TCP, ICMP and gRPC
The real value of the metrics format that Prometheus is using, is that tends to become an industry standard, the OpenMetrics standard. This means that in the future, an increasingly number of industry players will adopt it. The list is already long: https://prometheus.io/docs/instrumenting/exporters/
DB2 exporter
DB2 is one of the systems that are NOT offering an official exporter yet. It has its own set of metrics that is stored on internal (system) tables. You can retrieve the current value of any of these metrics using simple or complex SQL statements. For example, lets query db2 about the current used size of a specific tablespace named "USERSPACE1":
$ db2 connect to MYDB
$ db2 "SELECT TBSP_USED_SIZE_KB FROM SYSIBMADM.TBSP_UTILIZATION WHERE TBSP_NAME = 'USERSPACE1'"

TBSP_USED_SIZE_KB
-----------------
        885009792

  1 record(s) selected.

$
Its a good start, but what if we didn't know in advance the names of tablespaces that currently exists in DB2?
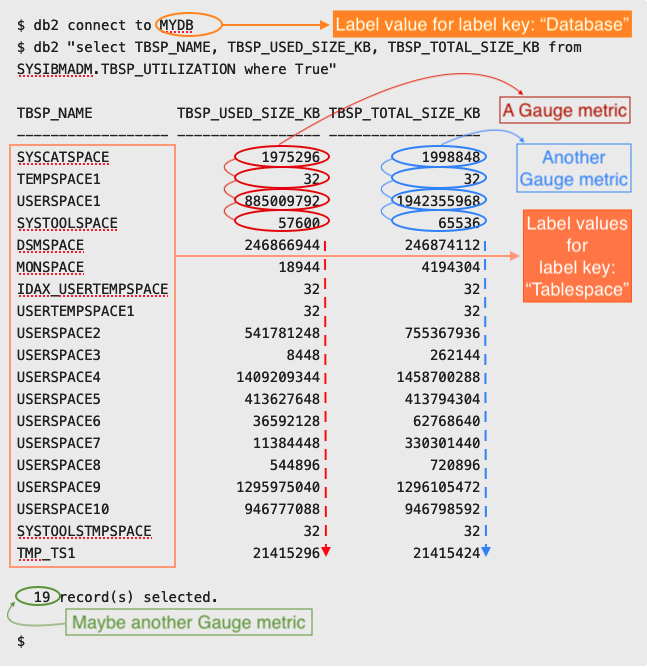
$ db2 "select TBSP_NAME, TBSP_USED_SIZE_KB from SYSIBMADM.TBSP_UTILIZATION where True"

TBSP_NAME          TBSP_USED_SIZE_KB
------------------ -----------------
SYSCATSPACE                  1975296
TEMPSPACE1                        32
USERSPACE1                 885009792
SYSTOOLSPACE                   57600
DSMSPACE                   246866944
MONSPACE                       15872
IDAX_USERTEMPSPACE                32
USERTEMPSPACE1                    32
USERSPACE2                 541781248
USERSPACE3                      8448
USERSPACE4                1409209344
USERSPACE5                 413626496
USERSPACE6                  36592128
USERSPACE7                  11384448
USERSPACE8                    544896
USERSPACE9                1295975040
USERSPACE10                946777088
SYSTOOLSTMPSPACE                  32
TMP_TS1                     21415296

  19 record(s) selected.

$
ok, now we discovered the available tablespaces and we have received the specific metric. But this table (or view) contains another metric, the total size of the tablespace. This is also useful for us because with a simple division we can calculate the percentage of the tablespace that is in use:
$ db2 connect to MYDB
$ db2 "select TBSP_NAME, TBSP_USED_SIZE_KB, TBSP_TOTAL_SIZE_KB from SYSIBMADM.TBSP_UTILIZATION where True"

TBSP_NAME          TBSP_USED_SIZE_KB TBSP_TOTAL_SIZE_KB
------------------ ----------------- ------------------
SYSCATSPACE                  1975296            1998848
TEMPSPACE1                        32                 32
USERSPACE1                 885009792         1942355968
SYSTOOLSPACE                   57600              65536
DSMSPACE                   246866944          246874112
MONSPACE                       18944            4194304
IDAX_USERTEMPSPACE                32                 32
USERTEMPSPACE1                    32                 32
USERSPACE2                 541781248          755367936
USERSPACE3                      8448             262144
USERSPACE4                1409209344         1458700288
USERSPACE5                 413627648          413794304
USERSPACE6                  36592128           62768640
USERSPACE7                  11384448          330301440
USERSPACE8                    544896             720896
USERSPACE9                1295975040         1296105472
USERSPACE10                946777088          946798592
SYSTOOLSTMPSPACE                  32                 32
TMP_TS1                     21415296           21415424

  19 record(s) selected.

$
Our "monitoring system" is already discovered a problem! The "USERSPACE1" tablespace is mostly free. We can reduce its size and release some storage but for now, let 's examine the above result set from the Prometheus point of view:
Naming metrics and labels
So we have two gauge metrics. We are free to give them any name but following OpenMetrics suggestions, they will be:
db2_tablespace_used_kilobytes: The space that is in use in the tablespace in kilobytes and
db2_tablespace_total_kilobytes: The total space of the tablespace in kilobytes
A label is always a key, value pair. So the two labels for every metric here will be:
"Database": "MYDB"
"Tablespace": "<Value of column TBSP_NAME>"
Of course we can create more labels like the hostname of the host that the database is running or the name of DB2 instance. We need to have the naming conventions and the least number of labels that will help us to identify a metric form another similar metric in our ecosystem.
PromQL
Let 's assume that we have a magic exporter that will run the SQL, get the metrics, name them (along with their description) and label them. Then will start listening on a tcp/ip port ready to serve them.
Prometheus will schedule a HTTP request to our magic exporter:
$ curl -X GET http://host:port/metrics
The response will be something like this:
# HELP db2_tablespace_used_kilobytes The space that is in use in the tablespace in kilobytes
# TYPE db2_tablespace_used_kilobytes gauge
db2_tablespace_used_kilobytes{Database="MYDB",Tablespace="SYSCATSPACE"} 1.97504e+06
db2_tablespace_used_kilobytes{Database="MYDB",Tablespace="TEMPSPACE1"} 32.0
db2_tablespace_used_kilobytes{Database="MYDB",Tablespace="USERSPACE1"} 8.84095616e+08
db2_tablespace_used_kilobytes{Database="XXXDB",Tablespace="SYSTOOLSPACE"} 57600.0
...
# HELP db2_tablespace_size_kilobytes The total space of the tablespace in kilobytes
# TYPE db2_tablespace_size_kilobytes gauge
db2_tablespace_size_kilobytes{Database="MYDB",Tablespace="SYSCATSPACE"} 1.998848e+06
db2_tablespace_size_kilobytes{Database="MYDB",Tablespace="TEMPSPACE1"} 32.0
db2_tablespace_size_kilobytes{Database="MYDB",Tablespace="USERSPACE1"} 1.942355968e+09
db2_tablespace_size_kilobytes{Database="MYDB",Tablespace="SYSTOOLSPACE"} 65536.0
...
Prometheus will scrap the above metrics and will store them in TSDB. The PromQL syntax to retrieve any of them for a specific time frame, will be as simple as this:
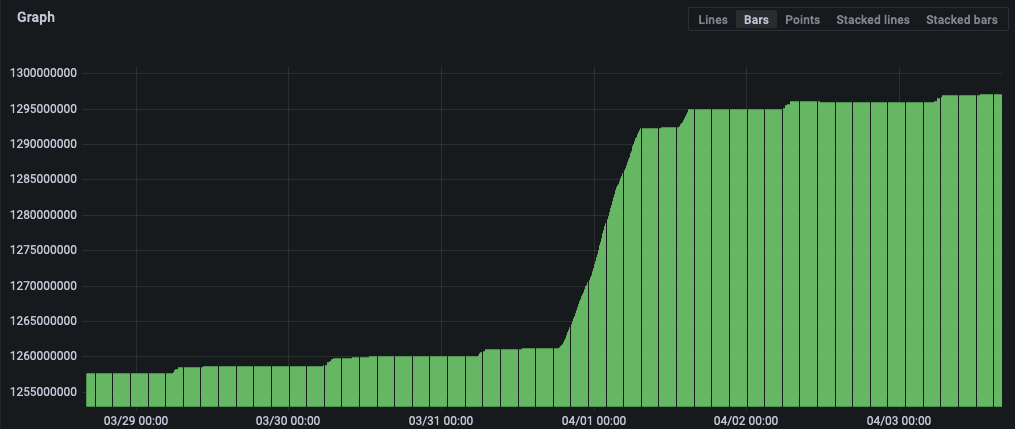
db2_tablespace_used_kilobytes{Database="MYDB",Tablespace="USERSPACE9"}...for a table with all the values measured for the specific metric in the timeframe:
Another example:
db2_tablespace_used_kilobytes{Database="MYDB",Tablespace="USERSPACE9"} / db2_tablespace_total_kilobytes{Database="MYDB",Tablespace="USERSPACE9"} * 100...will return a table with the percentages of the tablespace that was in use calculated by all the measures in the time frame.
We need to understand that the results from Prometheus are always multiple values that based on every measure in a time frame in comparison with DB2 that serves the value of a metric in the exact time that the query was executed.
So, its easy with Prometheus to run predictions of a value, simply as:
predict_linear(db2_tablespace_used_kilobytes{Database="MYDB",Tablespace="USERSPACE9"}[5d], 3600*24*5)...that will show us a prediction for the used space five days after the current time based on the measures of the last 5 days:
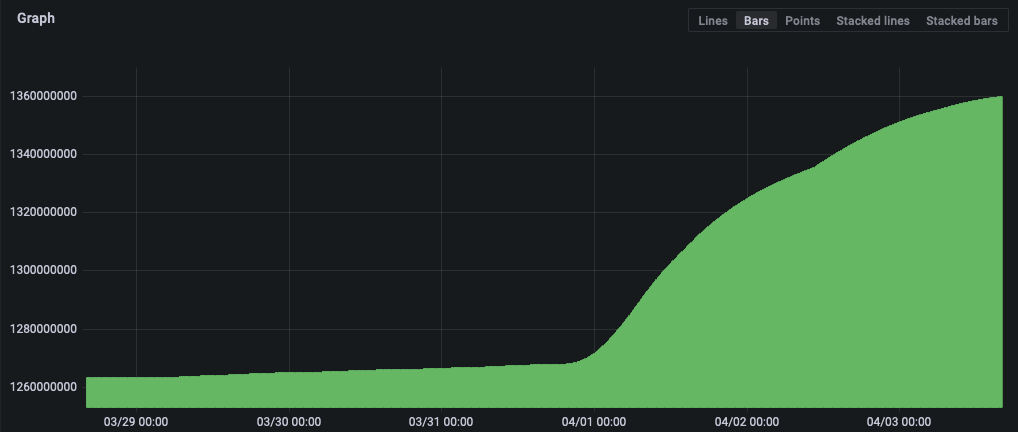
You can imagine alerts that will be firing on value predictions like this.
Get the metrics you need
We developed our exporter to give database administrators the flexibility to run their own SQL statements and create the metrics that fit in their environments. We avoided the effort to expose every available metric or decide for them which metric is useful and which is not. And we achieved this with the ability to externally configure the exporter with a YAML file:
---
<first metric group>:
  from: <DB2 Table to query>
  where: <possible filter(SQL)>
  labels:
    - <Label key>: <Column with the Label values>
    - <Another label>
    - ...
  gauges:
    - <Name of the Gauge metric>:
        <Column with the values of Gauge>: <Gauge description>
    - <Name of another Gauge metric>:
        <Column with the values of Gauge>: <Gauge description>
    - ...

<second metric group>:
  from: ...
...
For example, the following YAML file will configure our exporter to expose all the tablespace related metrics that we described:
---
tablespace_metrics:
  from: SYSIBMADM.TBSP_UTILIZATION
  where: True
  labels:
    - Tablespace: TBSP_NAME
  gauges:
    - db2_tablespace_used_kilobytes:
        TBSP_USED_SIZE_KB: The space that is in use in the tablespace in kilobytes
    - db2_tablespace_size_kilobytes:
        TBSP_TOTAL_SIZE_KB: The total space of the tablespace in kilobytes
On our repository you can find some more examples.
Wrap up
Check our exporter on this repository:
https://gitlab.com/monitoring22/db2_exporter
...and create your metrics for your environment (hopefully) without any need for code changes.
We will return with another article that will help visualizing those metrics using grafana specifically for DB2 ecosystems.
- Posted by Kostas KoutsogiannopoulosApril 3, 2022

